Ralph Nelson Elliott developed the Elliott Wave Theory in the late 1920s by discovering that stock markets, thought to behave in a somewhat chaotic manner, in fact traded in repetitive cycles.

Elliott discovered that these market cycles resulted from investors' reactions to outside influences, or predominant psychology of the masses at the time. He found that the upward and downward swings of the mass psychology always showed up in the same repetitive patterns, which were then divided further into patterns he termed "waves".

Elliott's theory is somewhat based on the Dow theory in that stock prices move in waves. Because of the "fractal" nature of markets, however, Elliott was able to break down and analyze them in much greater detail. Fractals are mathematical structures, which on an ever-smaller scale infinitely repeat themselves. Elliott discovered stock-trading patterns were structured in the same way.

Market Predictions Based on Wave Patterns
Elliott made detailed stock market predictions based on unique characteristics he discovered in the wave patterns. An impulsive wave, which goes with the main trend, always shows five waves in its pattern. On a smaller scale, within each of the impulsive waves, five waves can again be found. In this smaller pattern, the same pattern repeats itself ad infinitum. These ever-smaller patterns are labeled as different wave degrees in the Elliott Wave Principle. Only much later were fractals recognized by scientists.
 
In the financial markets we know that "every action creates an equal and opposite reaction" as a price movement up or down must be followed by a contrary movement. Price action is divided into trends and corrections or sideways movements. Trends show the main direction of prices while corrections move against the trend. Elliott labeled these "impulsive" and "corrective" waves.

Theory InterpretationThe Elliott Wave Theory is interpreted as follows:
  • Every action is followed by a reaction.
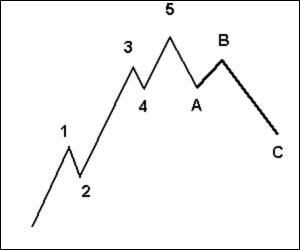
  • Five waves move in the direction of the main trend followed by three corrective waves (a 5-3 move).
  • A 5-3 move completes a cycle.
  • This 5-3 move then becomes two subdivisions of the next higher 5-3 wave.
  • The underlying 5-3 pattern remains constant, though the time span of each may vary.
Let's have a look at the following chart made up of eight waves (five up and three down) labeled 1, 2, 3, 4, 5, A, B and C.


You can see that the three waves in the direction of the trend are impulses, so these waves also have five waves within them. The waves against the trend are corrections and are composed of three waves.


cartoon-dollar.jpg